
Sensitive DNA detection for microelectrodes using HCR and DNAzyme electrocatalytic wires. Group I. Willner.
The DNA analyte-induced hybridization chain reaction (HCR) on electrode surfaces and the generation of hemin/G-quadruplex DNAzyme electrocatalytic wires, Figure 1 was used for the amplified and multiplexed electrochemical detection of DNA, Figure 1. Faradaic impedance spectroscopy, chronocoulometry and electrocatalyzed reduction of H2O2 using hemin/G-quadruplex DNAzyme labels were used as transduction means for the sensing events. Using several electrodes, multiplexed analysis of several DNA targets was demonstrated. The sensing platforms provided can be adapted for multiplexed sensing on chip arrays.
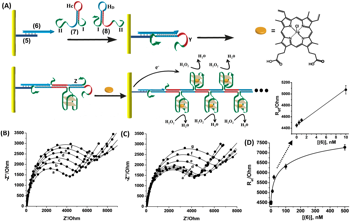
Figure 1. (A) Schematic presentation of the double-amplified detection of nucleic acid sequence (6) following hybridization chain reaction on an electrode surface. The HCR process generates G-quadruplex units, which, combined with hemin, electrocatalyze the reduction of H2O2 to H2O. (B) Faradaic impedance spectra obtained upon subjecting the (5)/(6)-modified Au electrode to the HCR process for variable time-intervals: (a) 0, (b) 15, (c) 25, (d) 35, (e) 45, and (f) 55 minutes. Measurements were performed at a (6) concentration of 500 nM. (C) Faradaic impedance spectra obtained upon subjecting the (5)-modified Au electrode to variable concentrations of the analyte (6): (a) 0, (b) 0.5, (c) 1.0, (d) 10 (e) 20, (f) 100, and (g) 500 nM, for 5 minutes, and allowing the HCR process to operate for 45 minutes. (D) Calibration curve showing the dependence of the interfacial electron transfer resistance values on the various concentrations of the analyte (6). Error bars correspond to a set of N=3 measurements. For clarity, the lower concentration region of the calibration curve was further magnified. All measurements were performed in the presence of a HEPES buffer (10 mM, pH=7.2) containing NaCl, 50 mM, KNO3, 20 mM, MgCl2, 20 mM, and 2 mM of K3Fe(CN)6 and K4Fe(CN)6. The HCR experiments were performed in the presence of 1 M of the hairpins (7) and (8). Data was recorded in the frequency range of 10 kHz to 100 mHz at E=0.17 V vs. SCE.