


Model-based evolutionary design of experiments uses nonlinear modeling at every generation to predict the next best experiments to try. This is an explicit form of exploitation of the structure present in all data up to that generation. Formally, the response surface  is approximated by a model,
  , and
, and  is re-fit each generation,
  . After
  is fit, it is typically sampled may times (10-100 times the number of experiments per generation) in order to find candidate experiments for the following generation, using response-proportional sampling.
An example of this procedure is illustrated below for an illustrative case of a two-dimensional experimental space:
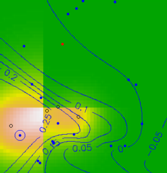
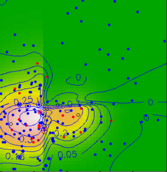
(a) (b)
In this study a synthetic response surface over a two dimensional experimental space was constructed, and is illustrated by the surface coded from green (low values) to white (high values). The synthetic response surface was formed with a superposition of half-Gaussians, where along a randomly chosen dimension, each Gaussian was set to zero on one side of its peak. The result is, as illustrated, a response surface with clear and substantial discontinuities.
Figure (a) represents with blue lines a model of the surface built from twenty randomly chosen points (the first generation). Figure (b) represents the application of the evolutionary optimization algorithm for seven generations, choosing twenty points each generation, with a fitness proportional choice, and with the top sampled values of the modeled response shown in red. Note that the candidate population clusters around the peaks, and the model becomes refined enough to well approximate the discontinuities. The model class used in this study was a neural network with two hidden layers, ten units each.
The model-based experiment selection is usually augmented with a purely exploratory sampling of the space, with a shaped distribution designed to avoid regions of the space already sampled.
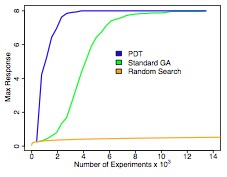
Below is a comparison of traditional DOE, a genetic algorithm, and model-based evolutionary optimization, using drug combination data from CombinatoRx (CRX):