Programmable Artificial Cell Evolution
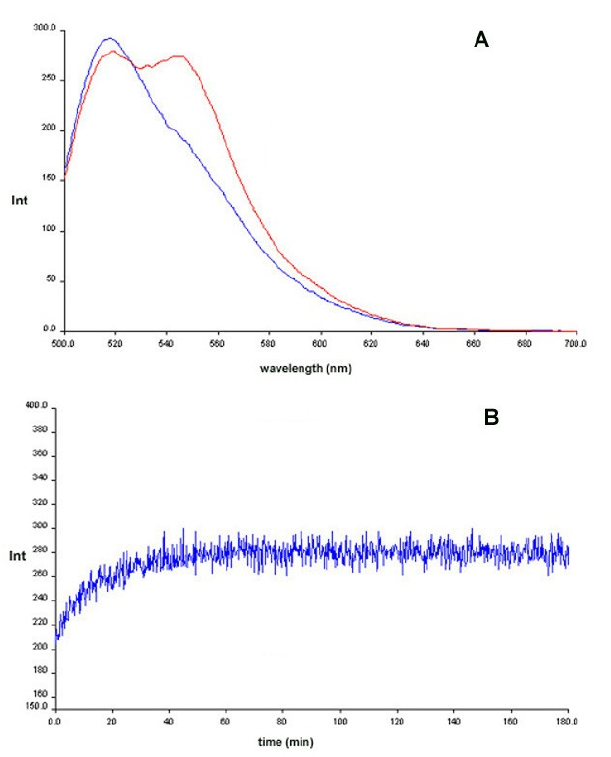
Figure 6: Chemical ligation of PNAs 2 & 3 using PNA 1 as template monitored by fluorescence (FRET) Blue: before EDC addition. Red: After EDC addition. Panel B: Time kinetics after EDC addition.