


In order to provide a clear picture of the evolutionary potential of a fully physically modelled artificial cell, we started a simulation with two cell types having amphiphiles with different intrinsic curvature potentials. We let the curvature of synthesized amphiphiles range over a factor of more than 10 (between values of 0.05 and 0.65 in inverse DPD space units), being inherited with a Gaussian distribution about the values of the amphiphiles that catalyze their synthesis.
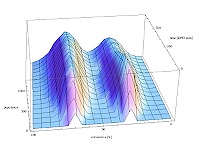
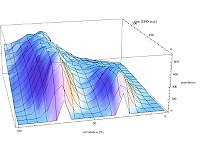
The result is a significant evolution of vesicles towards the synthesis of more highly membrane curving amphiphiles. The peaks in the frequency distributions shift to higher curvature and the more highly curved of the two discrete starting populations is selected against. Note that this selection is an intrinsic result of the simulation, and not externally imposed. It also provides an example (as in the more formal spin-lattice models) of the evolution of a cooperative phase behavior, requiring in evolutionary terms the solution of a complex cooperation problem. Individual amphiphiles only benefit from higher curvature if they participate in forming membranes with other highly curved amphiphiles.
The selection at the level of whole vesicles is illustrated in the figures in the side bar (at two different mutation rates), where the time course of various size groups of vesicles in the population are traced.