Towards PNA chemical replicators
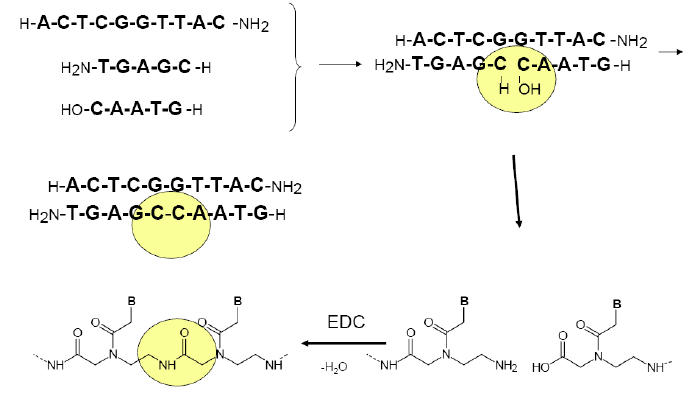
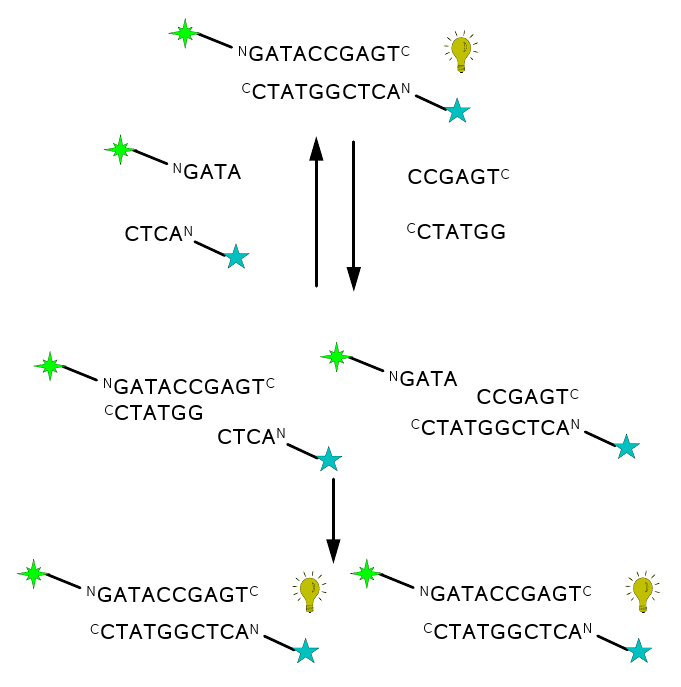
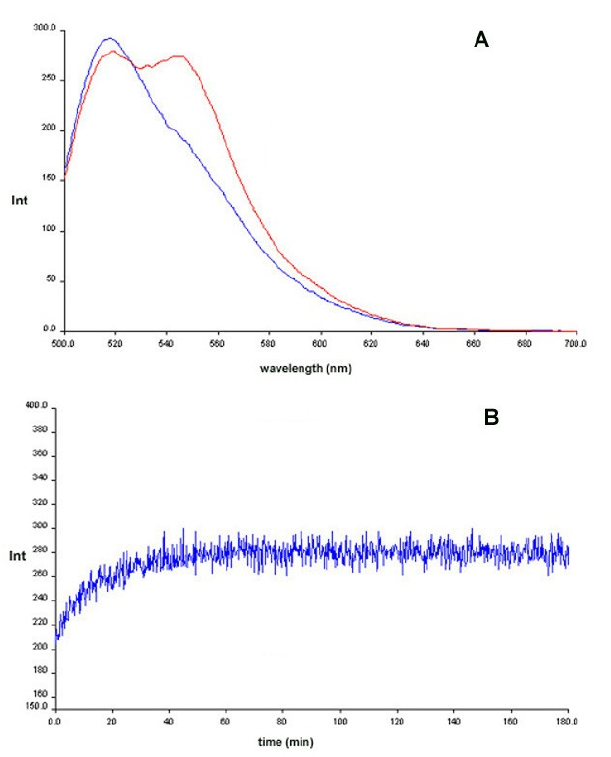
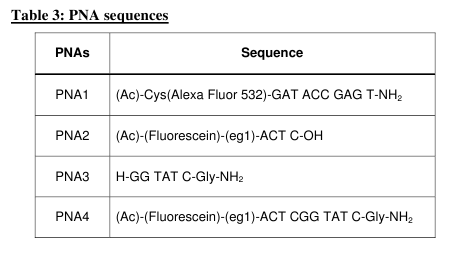
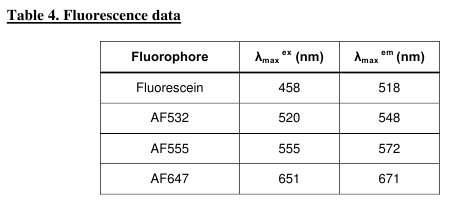
Experiments for characterization of PNA template directed PNA-PNA ligation reactions have been performed in aqueous medium according the general scheme Fig. 5a (see also Refs. [65, 66]). In order to allow subsequent implementation of a PNA replication system in a microfluidics environment as well as real time monitoring it was decided to establish a fluorescence readout based on FRET (fluorescence resonance energy transfer). We therefore designed a ligation-replication system as presented in Fig. 5. In order to optimize the system we first tested a system based on the fluorecein-AlexaFluor532 pair (Tables 3 & 4). In this system a weak but clear FRET signal around 550 nm was observed upon duplex formation between the two PNAs 1 & 4 (Fig. 6a), and it was also possible to obtain a fluorescence kinetics trace in a ligation reaction (Fig. 6b).
Figure 5: a) template directed PNA-PNA
ligation (condensation) scheme b) scheme of the PNA-PNA
ligation-replication cycle, starting with
one duplex (top) and ending with two (bottom). The strategy is to
measure the replicating turnover via FRET signal (bulb symbol)
appearing only
upon the formation of duplexes; hence the enhancement of the signal
after
each replication round. Building-block oligomers are asymmetric,
kvatromers and hexamers, to ensure lower hybridization tendency of
kvatromers and
hence lower signal that is not due to ligation. Kvatromers as well as
templates have FRET dyes so that duplexes have dyes at the opposite
ends since this combination generated the highest FRET signal.
Figure 6: Chemical ligation of PNAs 2
& 3 using PNA 1 as template monitored by fluorescence (FRET) Blue:
before EDC addition. Red: After EDC addition. Panel B: Time kinetics
after EDC addition.
However, control experiments showed
that
the kinetics reflected that EDC activation of the PNA was the rate
limiting step rather than the ligation per se. In view of this we
decided to explore the Cy3/Cy5 FRET pair which has proven more
effective in a DNA hybridization context (ref). However, for synthetic
reasons we resorted to the analogous AlexaFluor pair AF555/AF647 pair,
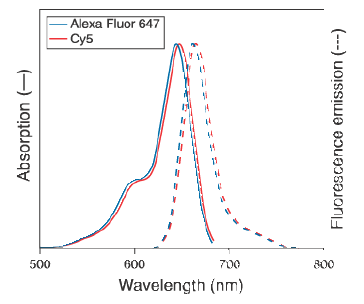
which have excitation/emission properties (Table 4,
Fig. 7) almost identical to those of the Cy3/Cy5
pair.
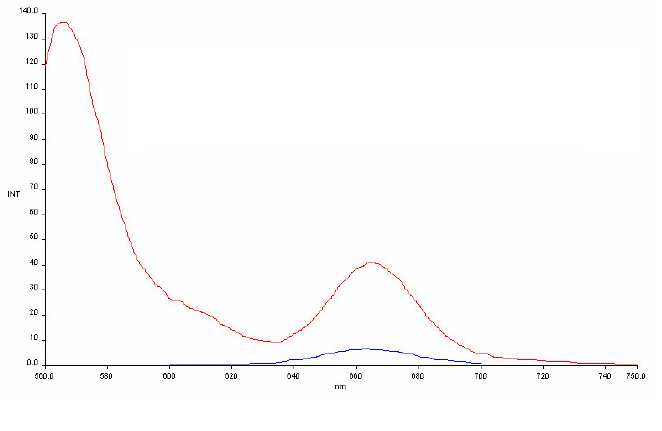
Using this pair in a PNA context we could obtain a FRET signal at 665
nm of more than 5 fold
(Fig. 8). A small series of PNA pairs were
synthesized having the two fluorophores at different positions in the
duplex (same end, opposite
ends or end and middle), and from these studies it was concluded the
same end system resulted in quenching and no FRET signal whereas the
end-middle system gave the highest FRET signal. As the latter
unfortunately is very poorly compatible with a ligation reaction and
leaves little freedom as to changes in the relative lengths of the
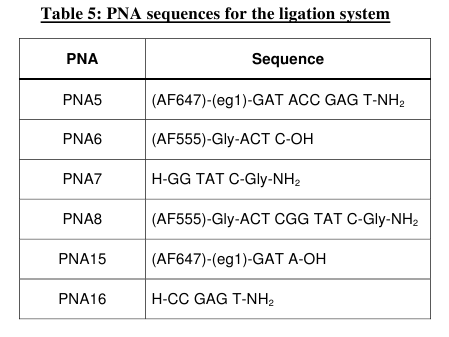
ligation, we decide to rely on an end-end system (Table
5). Thus this entire set of PNAs were synthesized and the two
individual EDC
activated ligation reactions (PNAs 5, 6 & 7 and PNAs 8, 15 &
16) were studied by HPLC, MALDI-TOF mass spectrometry and fluorescence
spectroscopy.
Figures 7) Absorption and emission spectra
of the AlexaFluor and Cy5 dyes. 8) FRET signal of a PNA
duplex-AlexFluor AF555/AF647 pair. Emission of single stranded
AF647-PNA (PNA5) (blue spectrum) and PNA555-PNA647 duplex (PNAs 8 &
5) (red spectrum) excited at the AF555 absorption wavelength (555nm).
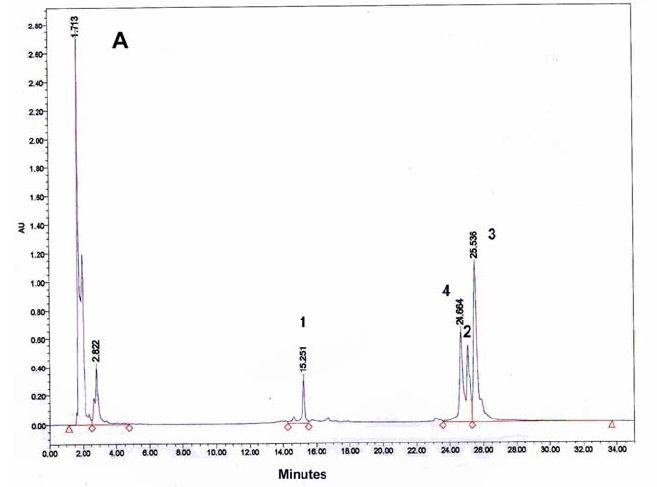
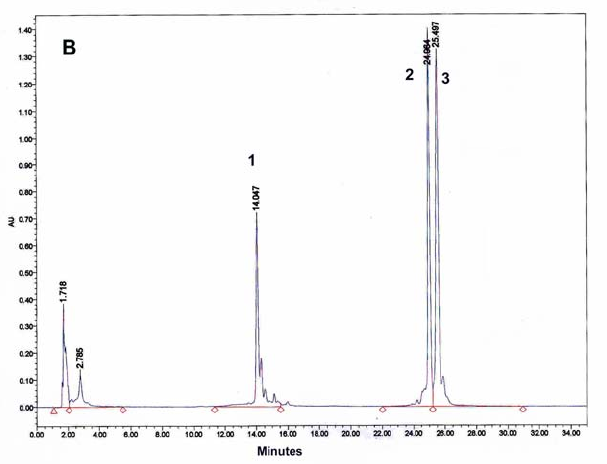
A typical HPLC trace for the PNA 5,
6, 7 ligation reaction is presented
in Fig. 9a. In the absence of EDC, only the
template (PNA5) and the
two short precursors (PNAs 6 &7) are detected (Fig.
9b). After
addition of EDC a new peak appears (no 4) and the relative intensity of
two of the peaks (nos 1 & 2) decreases, indicating that the
ligation product, 4, has formed at the expense of two precursors (1
& 2): This interpretation was confirmed by MALDI-TOF mass
spectrometric analysis (Fig. 9c) of all four
peaks, identifying these
as the four PNAs (7, 6, 5 & 8, respectively). Also the UV spectra
of the individual peaks in terms of the attached fluorophores was
consistent with this assignment. A similar analysis of the other half
(PNAs 8, 15, 16 & 5) yielded analogous results (Fig.
10), thereby
establishing both halves of the FRET PNA replicator.
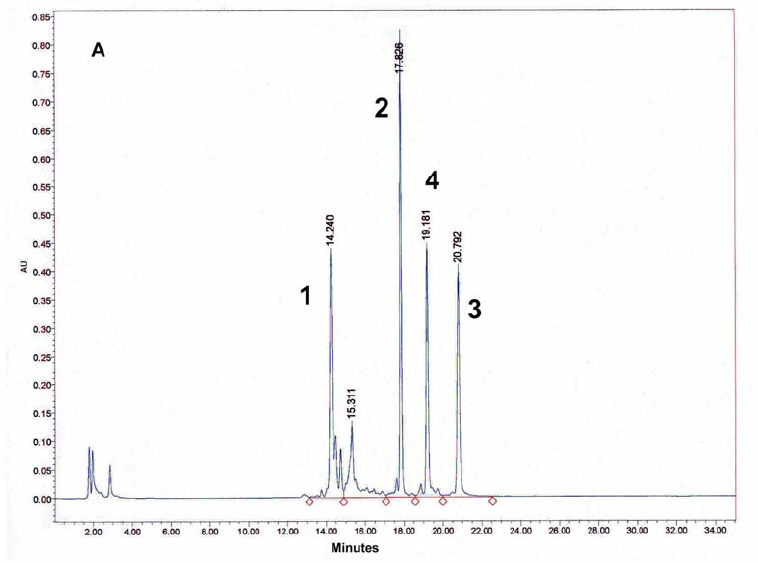
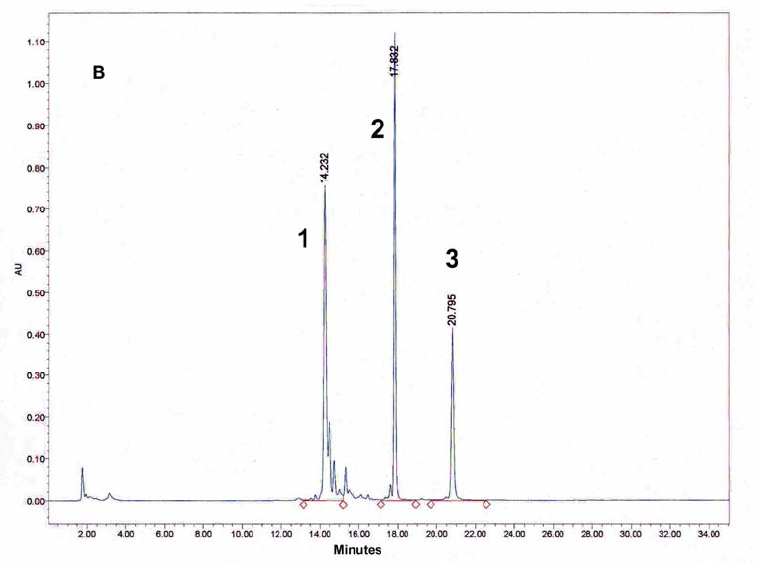
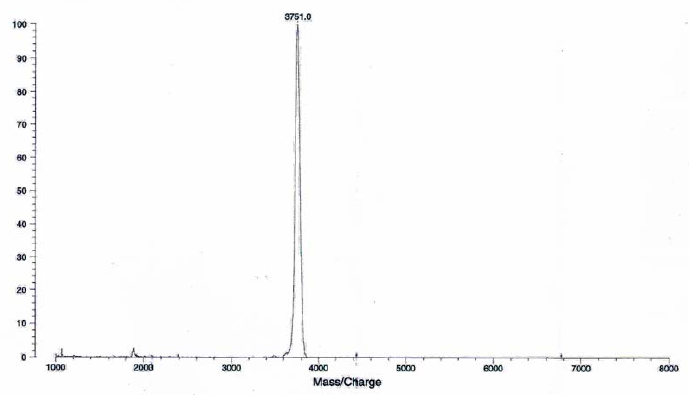
Figure 9: HPLC and MALDI-TOF mass spectrometric
analysis of chemical ligation of the PNA5-6-7 system (Table 5). Panel
B: ligation mixture before addition of EDC. Panel A: after EDC
addition. The identity of all peaks were verified by MALDI, e.g. panel
C for the product peak no 4.
Figure 10: HPLC and MALDI-TOF mass spectrometric analysis of chemical ligation of the PNA8-15-16 system (Table 7). Panel B: ligation mixture before addition of EDC. Panel A: after EDC addition. The identity of all peaks were verified by MALDI.


